Stay up-to-date with the status of our platform
TLDR: We have launched a new status page for Inoreader where you can stay informed about the status of our platform and its components – status.inoreader.com. For details, read on.
Inoreader may look like a simple and light service, but there’s actually a huge infrastructure behind it. We are currently running 20 powerful physical servers and twice as many virtual machines. Our article database layer and search index is more than 20 Terabytes in size and is still able to return all article requests and most search results with sub-second delay. The backend is processing millions of rules and monitoring feeds per hour, the PubSubHubbub service makes sure you receive your news in real time for supported feeds and the feed polling system takes care of the rest. Again, millions of feeds and updates are being processed every hour. And we are just scratching the surface here.
With so much going on, it’s easy to overlook a problem somewhere. Fortunately though, the team at Innologica is also specialized in monitoring systems, so we have you covered!
We have our own monitoring system called Insight that watches 24×7 the whole infrastructure, from hardware to the service level. Hardware malfunctions are often discovered even before an outage occurs at the node, e.g. failing hard drives are identified and replaced before they actually cause a crash. Network performance is monitored and trends are analyzed. If a bottleneck is forming, we are already looking into it before it becomes an issue. Hard drive is near capacity? No worries, we already have an alert. Even if the whole datacenter loses connectivity, we are again in the know, because we have a second monitoring system in another location. On the service level, we are monitoring all backend processes of Inoreader, queues and script heartbeats. All of this in a single place.
Today for the first time, we are sharing some screenshots of Insight – our in-house monitoring system. You may find it looks familiar. That’s because we are using our own framework for both Inoreader and Insight.


What this means to you – the Inoreader user? We want to reassure you that we are fully committed to deliver you top-quality service without interruptions and issues. However we live in the real world, not in a fairy tale, so incidents are bound happen. Our job is to minimize them and make sure they impact the service as little as possible.
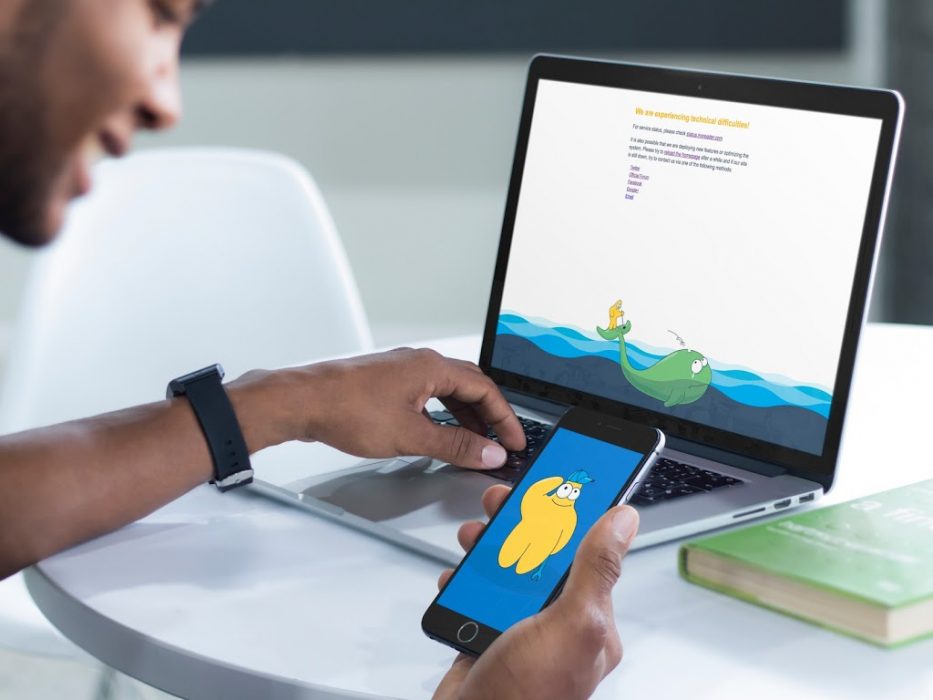
Announcing our status page

Our status page is completely integrated with Insight, so any interruption or degradation will be automatically reflected there within seconds. You can bookmark it and if you experience any strange behavior from our service, you can always check the page. At the bottom there are links to contact us.
P.S. If you need a status page that you can host yourself, check out Staytus. It’s amazing!
—
The Inoreader team